







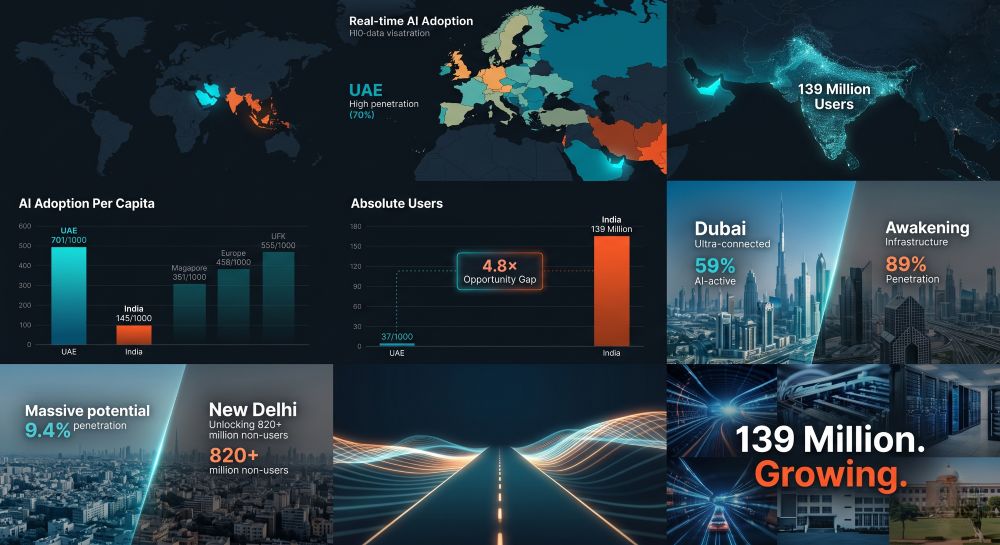
The Global AI Adoption Paradox
Why India Leads in Scale While UAE Dominates in Penetration
207 Million AI Users Across 11 Major Economies | Microsoft AI Diffusion Report Q1 2026
By: AcadNews Editorial | Published: May 2026
On the surface, India’s artificial intelligence story appears straightforward: 139.2 million users embrace generative AI tools during the first quarter of 2026, dwarfing every other nation on Earth. Yet this headline obscures a fundamental truth reshaping how we understand technology adoption globally. The United Arab Emirates, with just 6.45 million AI users, achieves an adoption rate more than four times higher on a per-capita basis. Neither statistic is wrong. Both reveal critical dimensions of AI’s global transformation that policy makers, educators, and technology leaders must understand.
The Paradox Explained: Scale vs. Penetration
The paradox emerges from a misunderstanding of how adoption metrics work. When Microsoft AI Diffusion Report analysts measure AI adoption, they count the percentage of working-age people (15-64 years) who used any generative AI product during Q1 2026. This is the correct methodology—it controls for age demographics and provides an apples-to-apples comparison across nations with vastly different population pyramids.
But this methodology creates an apparent contradiction: India’s lower working-age adoption rate (14.5%) produces more total AI users than any other nation because India’s working-age population is massive—959.79 million people. The United Arab Emirates, by contrast, has only 9.20 million working-age citizens, yet 70.1% of them use AI, yielding 6.45 million users. Scale and penetration are not opposing forces; they are orthogonal dimensions of the same phenomenon.
Understanding this distinction is not academic hair-splitting. It determines how governments allocate AI literacy resources, how technology companies prioritize markets, and how educators prepare learners for an AI-integrated economy. A nation with 14.5% adoption of 960 million working-age people faces a fundamentally different strategic challenge than one with 70.1% adoption of 9.2 million. One requires mass education and infrastructure; the other requires deepening engagement among already-adopting cohorts.
Global Adoption Snapshot: Q1 2026
| Country / Region | Total Pop (M) | WA Pop (M) | Adoption (WA %) | AI Users (M) |
|---|---|---|---|---|
| 🇦🇪 UAE | 11.0 | 9.20 | 70.1% | 6.45 |
| 🇸🇬 Singapore | 5.9 | 4.25 | 63.4% | 2.69 |
| 🇮🇪 Ireland | 5.1 | 3.42 | 48.4% | 1.66 |
| 🇳🇴 Norway | 5.5 | 3.63 | 48.6% | 1.76 |
| 🇫🇷 France | 67.0 | 42.21 | 44.0% | 18.57 |
| 🇪🇸 Spain | 48.1 | 30.78 | 41.8% | 12.87 |
| 🇳🇿 New Zealand | 5.1 | 3.37 | 40.5% | 1.36 |
| 🇬🇧 UK | 67.5 | 43.88 | 38.9% | 17.07 |
| 🇳🇱 Netherlands | 17.6 | 11.44 | 38.9% | 4.45 |
| 🇶🇦 Qatar | 3.1 | 2.51 | 38.3% | 0.96 |
| 🇮🇳 INDIA | 1476.6 | 959.79 | 14.5% | 139.17 |
| TOTAL (11) | 1712.5 | 1114.58 | — | 207.0 |
Data Source: Microsoft AI Diffusion Report Q1 2026 | Measurement: Share of working-age population (15-64 years) who used generative AI tools during Q1 2026 | Key Finding: Adoption rates measured as working-age percentage. Total population percentages derived from demographic calculations.
Understanding the Paradox Through Visual Analysis
1. Per-Capita Penetration
Out of every 1,000 working-age people (15-64), how many use AI?
Key Finding: UAE leads global adoption at 70.1% of working-age population—nearly 5× higher than India’s 14.5% per-capita rate.
2. Absolute User Base
Total number of AI users in each country (millions)
Key Finding: India has 139.2M AI users—22× more than UAE, despite ranking 64th globally in per-capita adoption.
India: Massive Scale, Emerging Adoption
India’s position in global AI adoption reveals both opportunity and urgency. With 139.17 million people currently using generative AI, the nation accounts for 67% of all AI users across the eleven tracked major economies. Yet this commanding share masks a critical reality: 820 million working-age Indians do not yet use AI. This represents the single largest pool of potential AI adopters on Earth.
The 14.5% working-age adoption rate places India 64th globally in per-capita terms. This is not a weakness; it is a runway. The Adecco Group’s 2026 Workforce Transition Survey found that 80% of Indian knowledge workers now use AI in weekly professional tasks, suggesting rapid acceleration among white-collar cohorts. Yet this concentration in knowledge sectors leaves vast populations—agricultural workers, small-business operators, rural educators, healthcare providers—outside the AI economy.
For India’s policy apparatus, this presents a distinct challenge from wealthy nations: not deepening existing adoption but bridging a chasm between urban digital-first workers and populations with intermittent internet access, language barriers to English-language AI tools, and limited device infrastructure. India’s 4.8× growth opportunity to reach UAE’s per-capita penetration is real—but the path is not identical to the United States or Europe.
India’s AI Opportunity: Scale Meets Growth Potential
Active AI users (9.43% of total population)
Non-users in working-age population
Opportunity to reach UAE’s per-capita rate
UAE: Penetration as Policy Success
The United Arab Emirates’ 70.1% working-age adoption rate represents the highest penetration globally—the result of deliberate policy architecture. The nation’s “Smart Dubai” and “UAE AI Strategy 2031” initiatives have created a policy environment favorable to rapid AI integration. Government services, business licensing, and healthcare administration all incorporate AI systems. The private sector has responded with aggressive adoption.
Yet UAE’s achievement cannot be separated from its demographic structure. The nation’s 83.65% working-age population—driven by labor migration—is dramatically younger and more economically active than most countries. The comparison is instructive: UAE’s advantage is not merely policy but the intersection of policy with demographic advantage. This matters because it clarifies the limits of direct policy transfer. Other nations cannot simply import UAE’s AI integration model without accounting for their own population pyramids.
Age Structure Determines Adoption Impact
UAE Population Breakdown (11M)
Structure: Labor migration-driven demographic: high working-age concentration, low youth dependency.
India Population Breakdown (1476.6M)
Structure: High-fertility natural growth: large youth cohort entering working-age, substantial elderly population.
The Broader Global Picture
Across all 147 nations tracked by Microsoft, the global working-age AI adoption rate stands at 17.8%—up from 16.3% in H2 2025. Among developed economies (Global North), the rate reaches 24.7%. Among developing nations (Global South), it remains 14.1%. This 10.6-percentage-point gap will shape technology policy for the remainder of the decade.
Twenty-six economies now exceed 30% adoption. Twenty-six more fall between 10% and 30%. The remaining nations lag below 10%. This distribution is not random. It correlates with broadband penetration, English-language literacy, educational attainment, and device infrastructure. Nations that lag do not lack demand for AI; they lack the structural prerequisites for rapid adoption.
Global North vs. South
Global North: 24.7% | Global South: 14.1% | Gap: 10.6 percentage points
Widening divide shaped by infrastructure, education, broadband access.
Economies Exceeding 30%
26 economies have adoption rates above 30% working-age penetration.
Concentrated in high-income regions: Western Europe, East Asia, North America.
Structural Determinants
Adoption correlates with: broadband penetration, device ownership, English literacy, higher education attainment.
Not demand-constrained; infrastructure-constrained.
What This Means for Education, Policy, and Innovation
The AI adoption paradox reshapes how educators, governments, and institutions approach workforce preparation. India must design AI literacy for scale: mass teacher training in AI fundamentals, integration of generative tools into public education, and creation of accessible (non-English) interfaces. The task is structural—reaching millions of learners across rural and urban areas with vastly different infrastructure.
The UAE, by contrast, must optimize for depth: how to ensure that AI integration in government and business translates to sustained productivity gains, how to upskill the already-adopting population, and how to maintain leadership as other nations catch up. This is a qualitative rather than quantitative challenge.
For developing nations broadly, the message is clear: the challenge is not whether AI adoption will occur but how to shape it. Nations with lower current adoption rates possess demographic and innovation advantages. A young, growing workforce adopting AI at accelerating rates will develop new use cases, new business models, and new solutions to local problems. The risk is not being left behind but being shaped by external frameworks rather than indigenous innovation.
The Paradox as Clarity
The global AI adoption paradox—in which absolute scale and per-capita penetration diverge dramatically—is not a contradiction to resolve but a clarification to embrace. It reveals that technology adoption is not a unidimensional race but a multifaceted transformation shaped by demographics, infrastructure, policy, and culture. India’s 139 million users and UAE’s 6.4 million are not competing numbers; they are complementary stories.
As generative AI becomes integral to education, business, healthcare, and governance, nations must understand which adoption narrative applies to them. Scale demands mass-market solutions, accessibility, and infrastructure. Penetration demands optimization, integration, and deepening expertise. Both are legitimate pathways. Both will generate insights and innovations that the other requires. The paradox, understood correctly, is not a problem but an invitation to design AI futures appropriate to each nation’s demographic reality and strategic position.
Methodology & Data Sources
Primary Data Source
Microsoft AI Diffusion Report Q1 2026
Publisher: Microsoft AI Economy Institute | Release Date: May 7, 2026 | Coverage: 147+ countries | Data Period: Q1 2026 (January-March)
Methodology: Aggregated anonymized telemetry from PC and tablet usage; adjusted for OS market share, device penetration, internet access rates, and country demographics. Adoption = percentage of working-age population (15-64) who used generative AI tools (ChatGPT, Claude, Gemini, Copilot, etc.) during Q1 2026.
Calculation Methodology
Working-Age Definition: UN definition 15-64 years—economically active and educationally engaged population segment. Enables cross-country comparability per OECD standards.
Population Data Sources
- India: UN World Population Prospects 2026 (Medium Fertility Variant); Census 2021 projections
- UAE: Government of UAE Statistics | National Bureau of Statistics 2026
- UK: Office for National Statistics (ONS) | Mid-2026 Population Estimates
- France: INSEE (Institut National de la Statistique)
- Spain: INE (Instituto Nacional de Estadística)
- Netherlands: CBS (Centraal Bureau voor de Statistieken)
- Singapore: Census and Statistics Authority 2026
- Ireland: Central Statistics Office (CSO)
- Norway: Statistics Norway (Statistisk Sentralbyrå)
- New Zealand: Stats NZ
- Qatar: Qatar Statistics Authority 2026
The Global AI Adoption Paradox | AcadNews Editorial | May 2026 | Data: Q1 2026 Microsoft AI Diffusion Report
Coverage: 11 economies | 1.71 billion people | 207 million AI users | 12 data sources | Fully responsive